
Wine is an alcoholic beverage made from grapes with an incredibly rich history and diversity of styles. One of the biggest factors influencing a wine’s flavor profile is the type of grape used. There are thousands of grape varieties, each contributing unique characteristics to the wine. Understanding these differences can help wine enthusiasts and professionals alike appreciate the nuances of different wines.
In this post, I analyzed a dataset of nearly 50,000 wines to visualize how different grape types influence wine characteristics such as alcohol content, acidity, and body. The data is from the X-Wines project, which contains tens of thousands of wines and millions of reviews. I used Python’s Pandas and Plotly libraries to process the data and create visualizations. The data source and Jupyter notebook are linked at the bottom of this post.
Data set overview
The dataset contains information on nearly 100,000 wines, including:
- Name
- Country
- Region
- Type (red, white, rose, dessert, etc.)
- Grape type
- Alcohol content
- Acidity (low, medium, high)
- Body (very light, light, medium, full, very full)
- And other characteristics
To make the dataset manageable, I applied some filtering:
- Excluded wines that were a blend of multiple grape types.
- Kept only the top 50 grape types based on the number of wines available.
- Removed other types of wines (e.g. sparkling, dessert, rose, etc.)
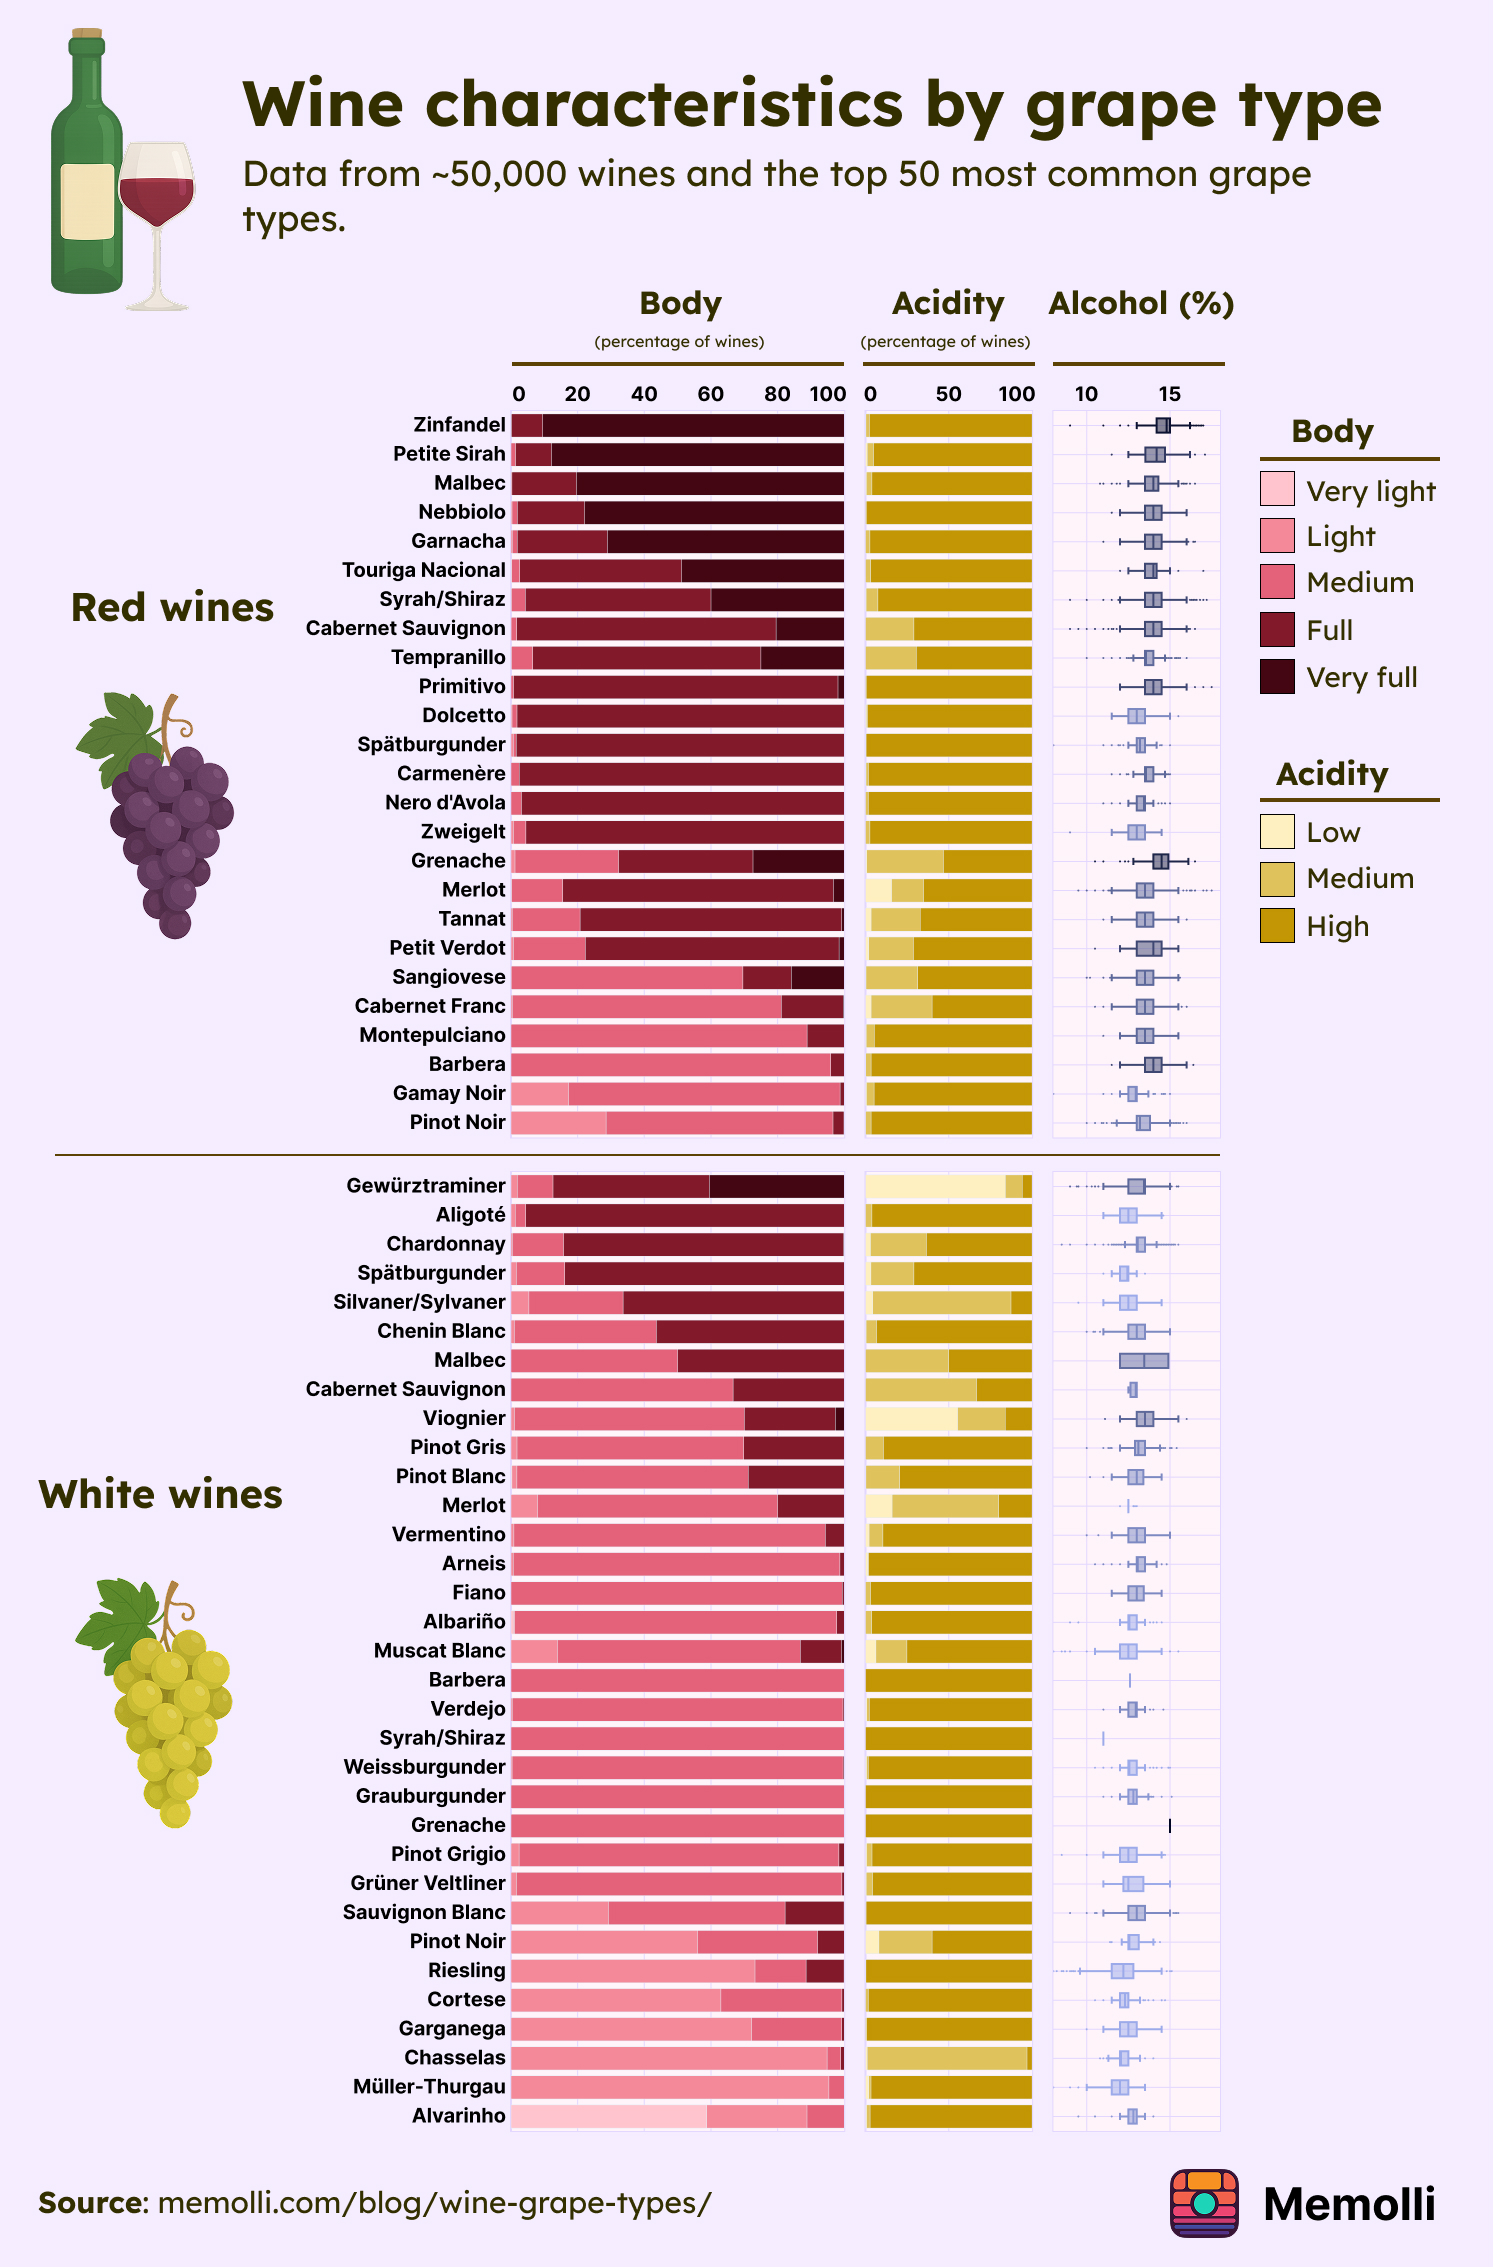
Key takeaways:
- Red wines tend to have higher alcohol content than white wines.
- Red wines generally have heavier body than white wines.
- White wines have a slightly lower amounts and wider range of acidity levels compared to red wines.
Download high-res image
Sources
The figure was made using Python’s Plotly library and Figma.
Data Source:
Jupyter Notebook:
References
- de Azambuja, R.X.; Morais, A.J.; Filipe, V. X-Wines: A Wine Dataset for Recommender Systems and Machine Learning. Big Data Cogn. Comput. 2023, 7, 20. https://doi.org/10.3390/bdcc7010020.